Energy
Solar systems
From array layout to interconnection, solar design is a coordinated building system.
Review site orientation, shading, mounting, structural loads, wiring, inverter selection, disconnects, batteries, monitoring, utility interconnection, and maintenance. Use current permitting and electrical requirements; the preserved archive includes examples and drawings for study.
Three solar-cell technologies

Monocrystalline silicon — 單晶矽
A single-crystal structure supports efficient conversion. Conventional monocrystalline modules generally provide more rated power per unit area than comparable polycrystalline and amorphous-silicon modules, making efficient use of limited roof space.
Polycrystalline silicon — 多晶矽
Multiple crystal grains give the cells their mottled appearance. Conventional products generally have lower conversion efficiency than comparable monocrystalline products, requiring more area for the same rated capacity.
Amorphous silicon — 非晶矽薄膜
A thin silicon layer without a crystal lattice converts sunlight into electricity. It generally needs more area for the same rated capacity; some products use lightweight or flexible substrates. Amorphous silicon is one thin-film technology, not a description of all thin-film panels.
Compare actual module specifications. Equal-area arrays can have different ratings; equal-kW arrays do not automatically produce more energy just because one is monocrystalline.
Natural Resources Canada: PV technology background (archived guide) · DOE: solar-cell basics
Output depends on operating conditions
Sunlight intensity, cell temperature, shading, orientation, and system losses affect production. Higher cell temperatures generally reduce conversion efficiency. Compare temperature coefficients and low-light performance in the manufacturer's data; material names alone do not determine annual yield.
Regional sunlight and peak sun hours
Understand the units
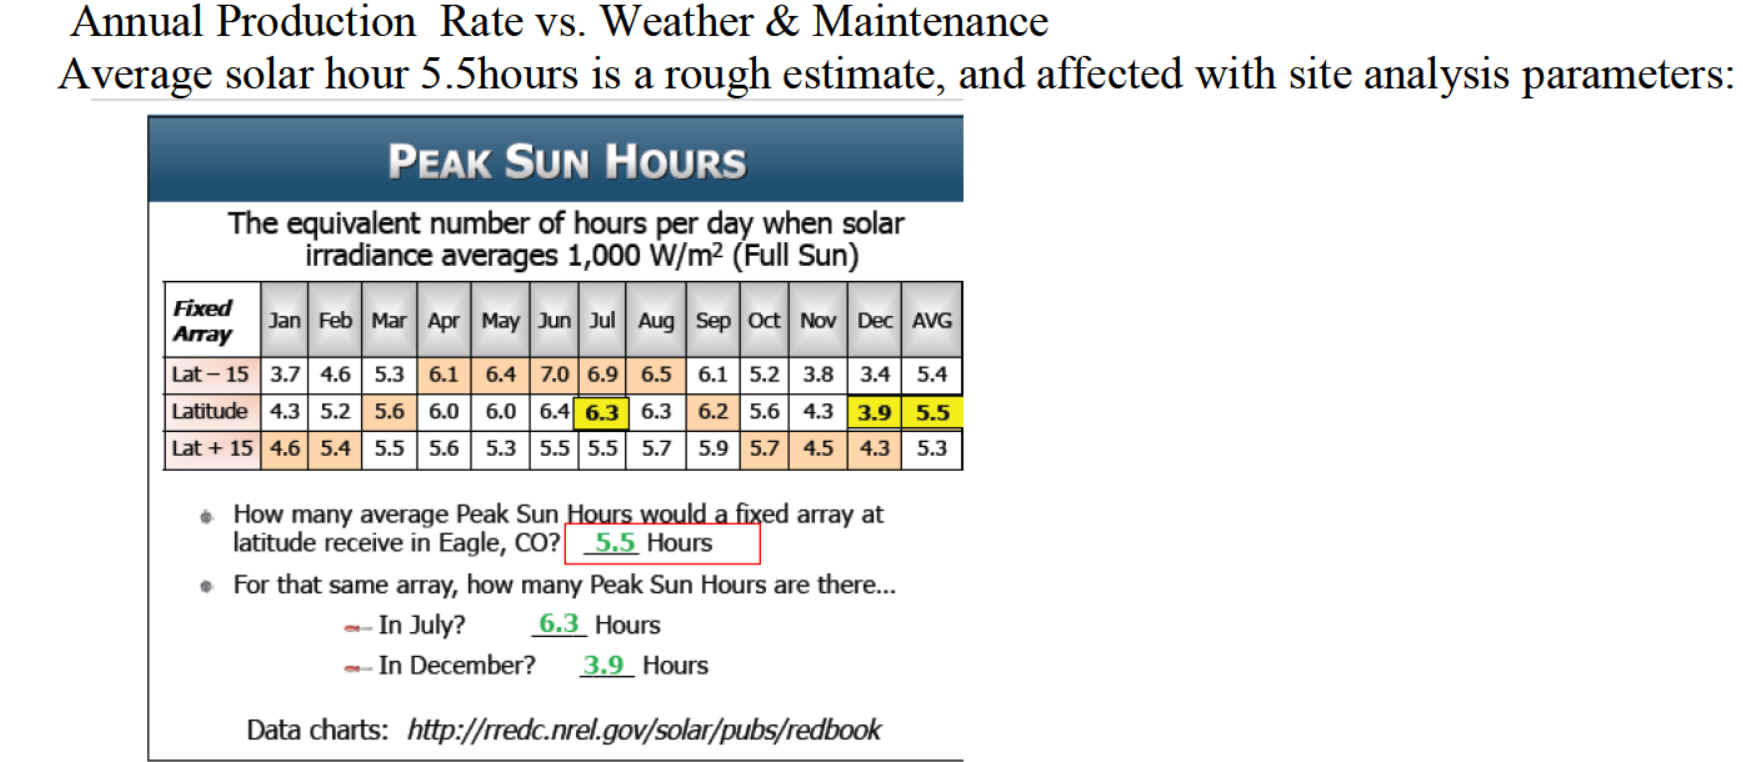
Irradiance (W/m²) measures instantaneous sunlight power. Irradiation (kWh/m²/day) measures accumulated daily solar energy. Peak sun hours express that energy as equivalent hours at 1,000 W/m²: 5.5 kWh/m²/day equals 5.5 peak sun hours, not 5.5 hours of daylight.
Read the chart
“Latitude” means array tilt equal to the site's latitude. “Lat − 15” and “Lat + 15” change that tilt by 15 degrees; they are not three regions. The latitude-tilt example shows 6.3 peak sun hours in July, 3.9 in December, and an annual daily average of 5.5.
Compare different regions
Latitude, cloud cover, local weather, and season change the available solar resource. Tilt and orientation determine how much reaches the array surface. Compare locations using the same system size, tilt, direction, and loss assumptions, then review monthly and annual production.
Use location-specific weather data instead of applying 5.5 hours everywhere. Hot sunny locations still require temperature-loss analysis; local shade and soiling also affect yield.
Learning example
Daily energy ≈ DC array rating × peak sun hours on the array plane × net performance factor.
For illustration: 5 kW × 5.5 h × 0.80 = 22 kWh/day. The 0.80 factor is an example, not a code requirement or guaranteed performance. Use a site-specific model for project estimates.
Commercial building example
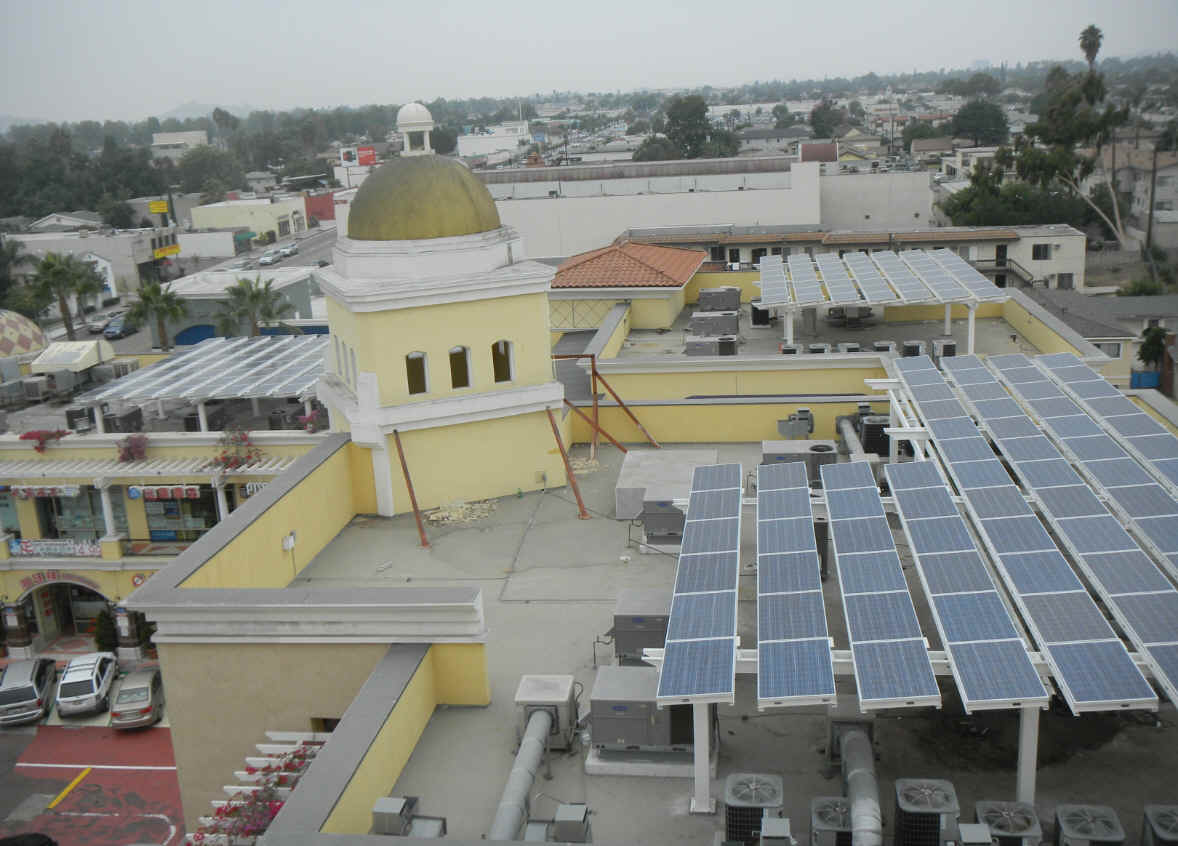
Solar installation on a commercial building
Reading the installation
The photograph shows several groups of solar panels on raised support frames. The arrays share roof space with air-conditioning equipment, ducts, and the building's architectural features.
This example highlights the coordination involved in commercial solar layout: panel placement, supporting structure, existing equipment, and space for maintenance must be considered together. Study where the arrays sit relative to the rooftop equipment and taller building elements.
The photograph illustrates the arrangement; it does not establish system capacity, annual energy production, or code compliance. Those details require project drawings, equipment data, and site analysis.